Absolute and relative forecasts
This guide shows how to load absolute and relative forecast data with the add-in.
Absolute forecast
Section titled “Absolute forecast”-
Select the cell to the right of the Absolute cell.
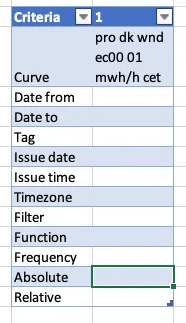
-
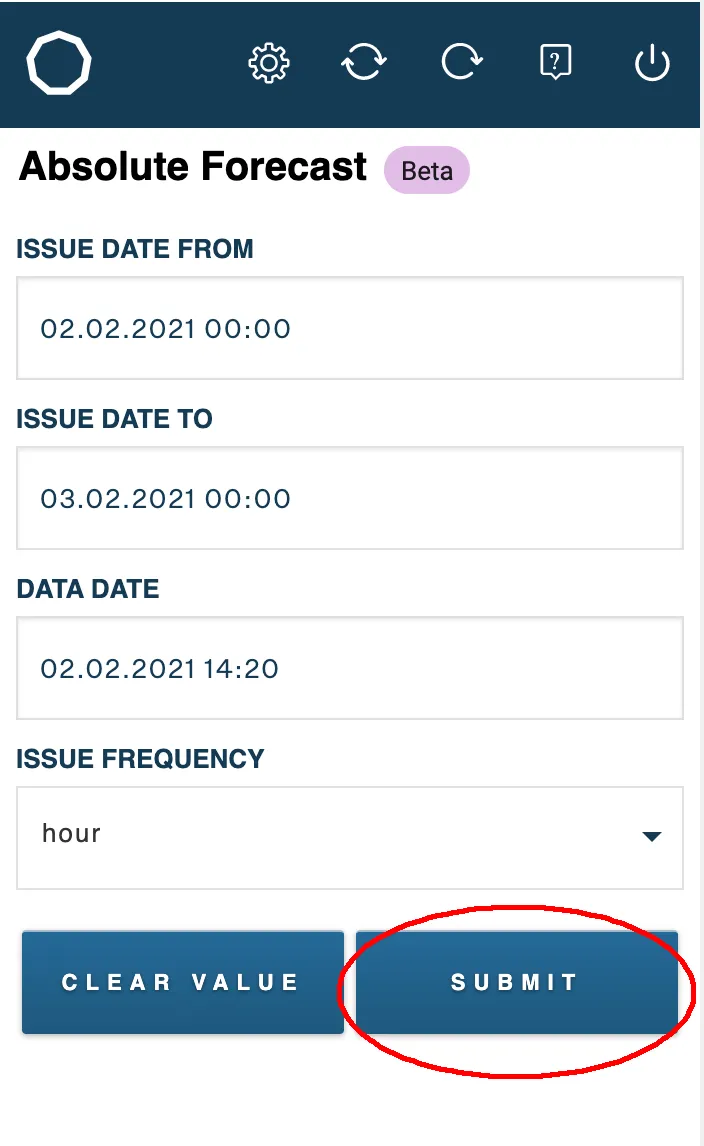
The absolute forecast options appear in the add-in panel.
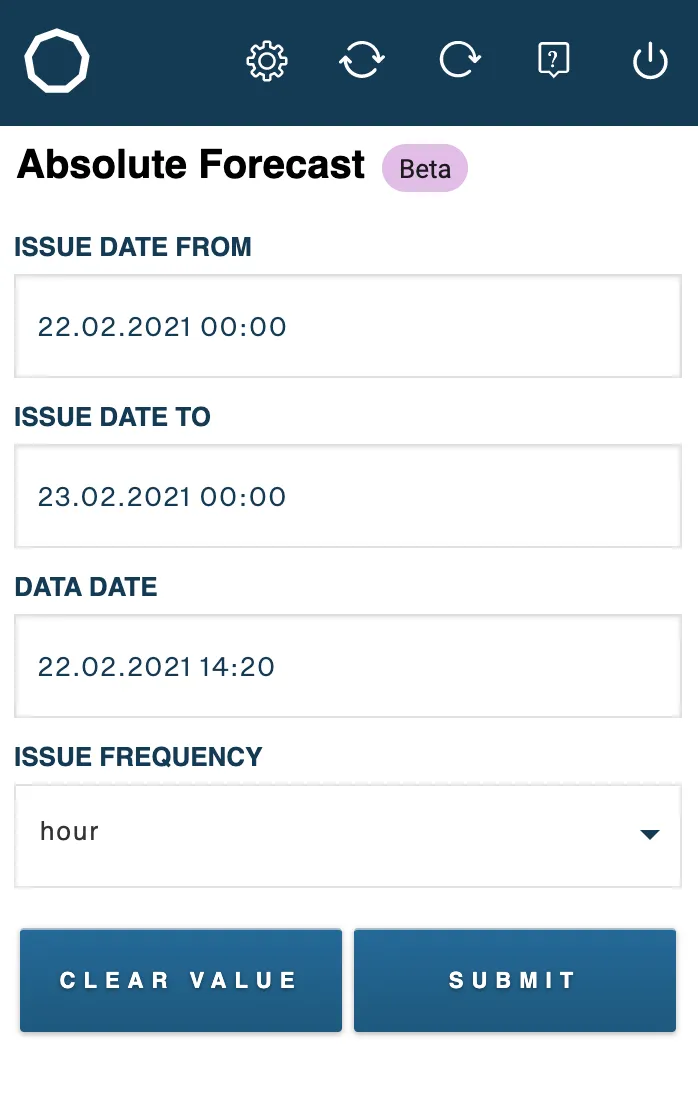
-
Pick the Issue Date From and Issue Date To. By default, the latest issue date is used.
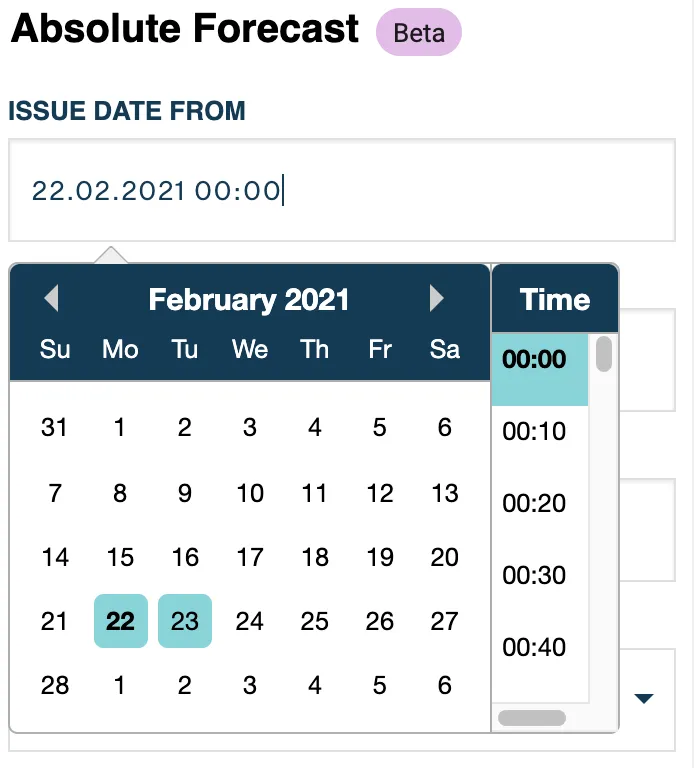
-
Optionally filter the forecast by Date Time.
-
Optionally choose the issue frequency, which is the frequency of the output time series.
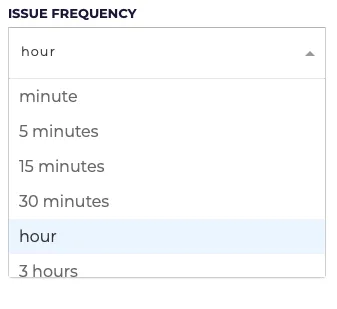
-
Click Submit.
-
The parameters are added to the cell.

You can edit the parameters directly in the cell, or click Clear to remove them all.
-
Click refresh or refresh all in the top bar to load the data.

Learn more about absolute forecasts in the API documentation.
Relative forecast
Section titled “Relative forecast”-
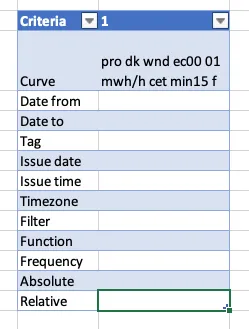
Select the cell to the right of the Relative cell.
-
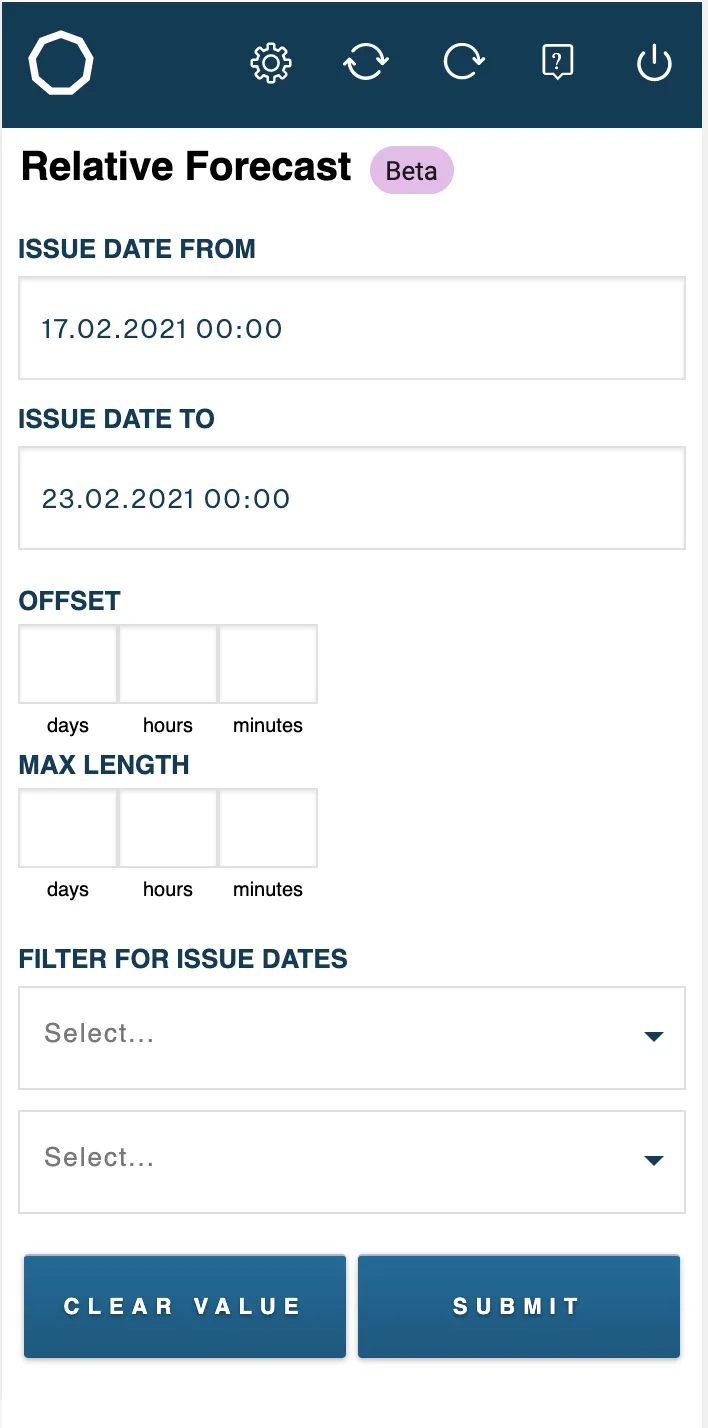
The relative forecast options appear in the add-in panel.
-
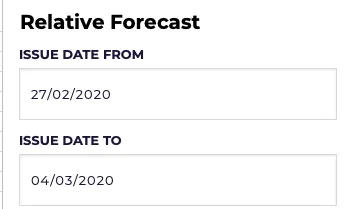
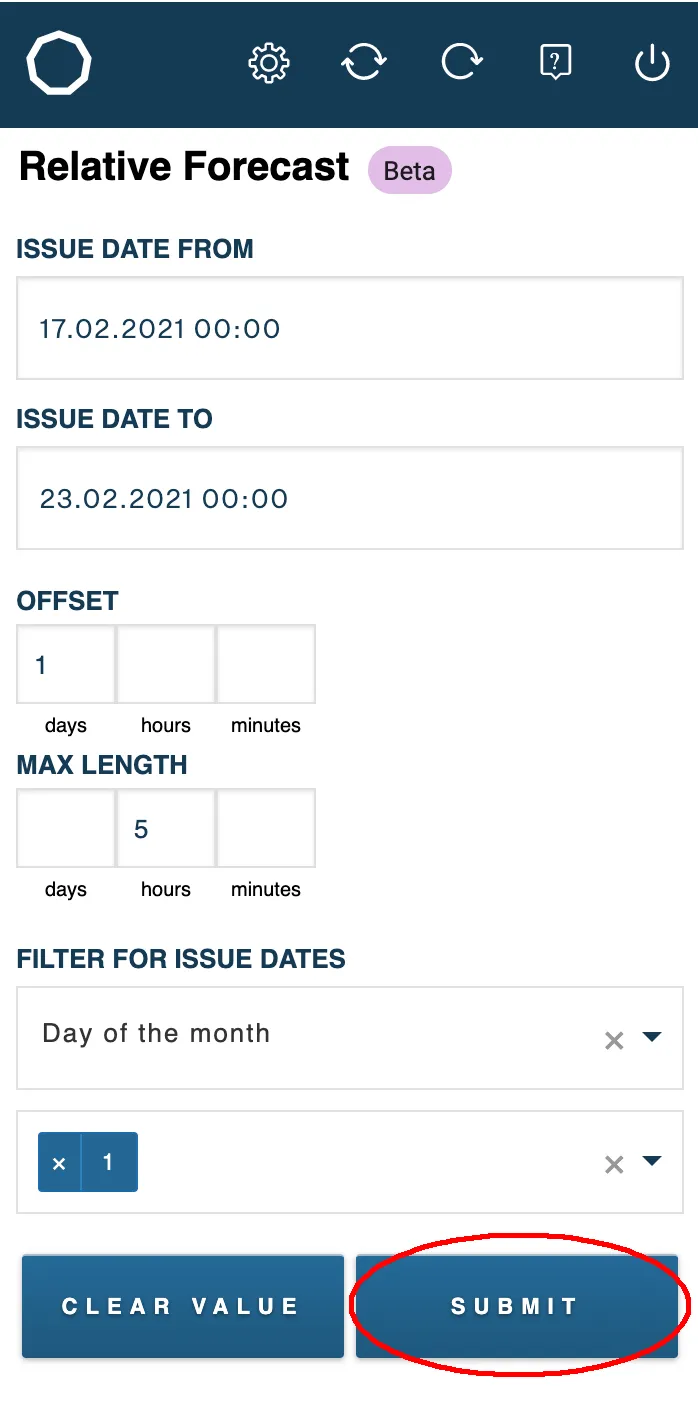
Pick the issue dates, as for absolute forecasts.
-
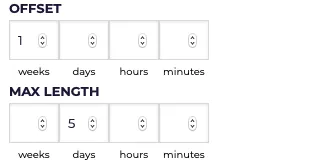
Set the Offset and Max Length. The offset is where the data starts, measured from the issue date. The max length sets where the subset ends.
-
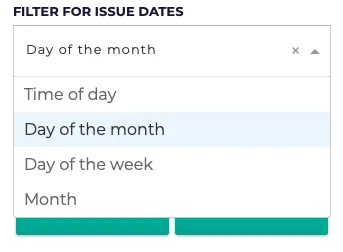
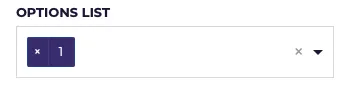
Optionally use Filter for Issue Dates to limit issue dates to specific time periods.
-
Click Submit.
-
The parameters are added to the cell.

You can edit the parameters directly in the cell, or click Clear to remove them all.
-
Click refresh or refresh all in the top bar to load the data.
Learn more about relative forecasts in the API documentation.