Absolute and relative forecasts
These endpoints work on instance and tagged instance curves. They let you look at forecasts
across many issues at once. Paths are relative to the base URL
https://data-forecasts.volue.com/api/v1/timeseries.
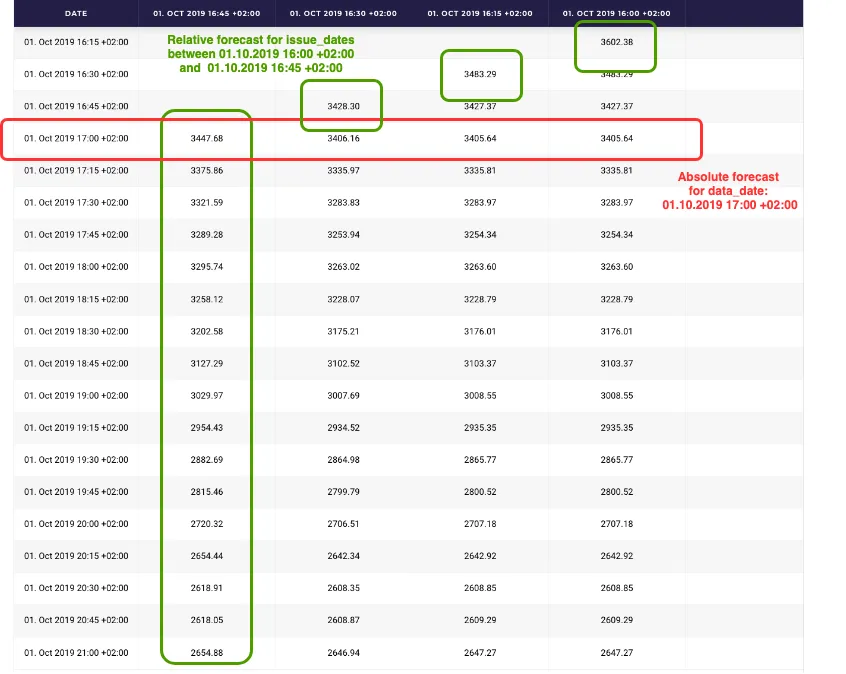
Absolute forecast
Section titled “Absolute forecast”GET /instances/{id}/absoluteGET /instances/tagged/{id}/absoluteAn absolute forecast is a time series of the forecast for a single point in time
(data_date). The dates of the time series are the issue_dates of the instances. Use it to
track how the forecast for one point in time changes across issues.
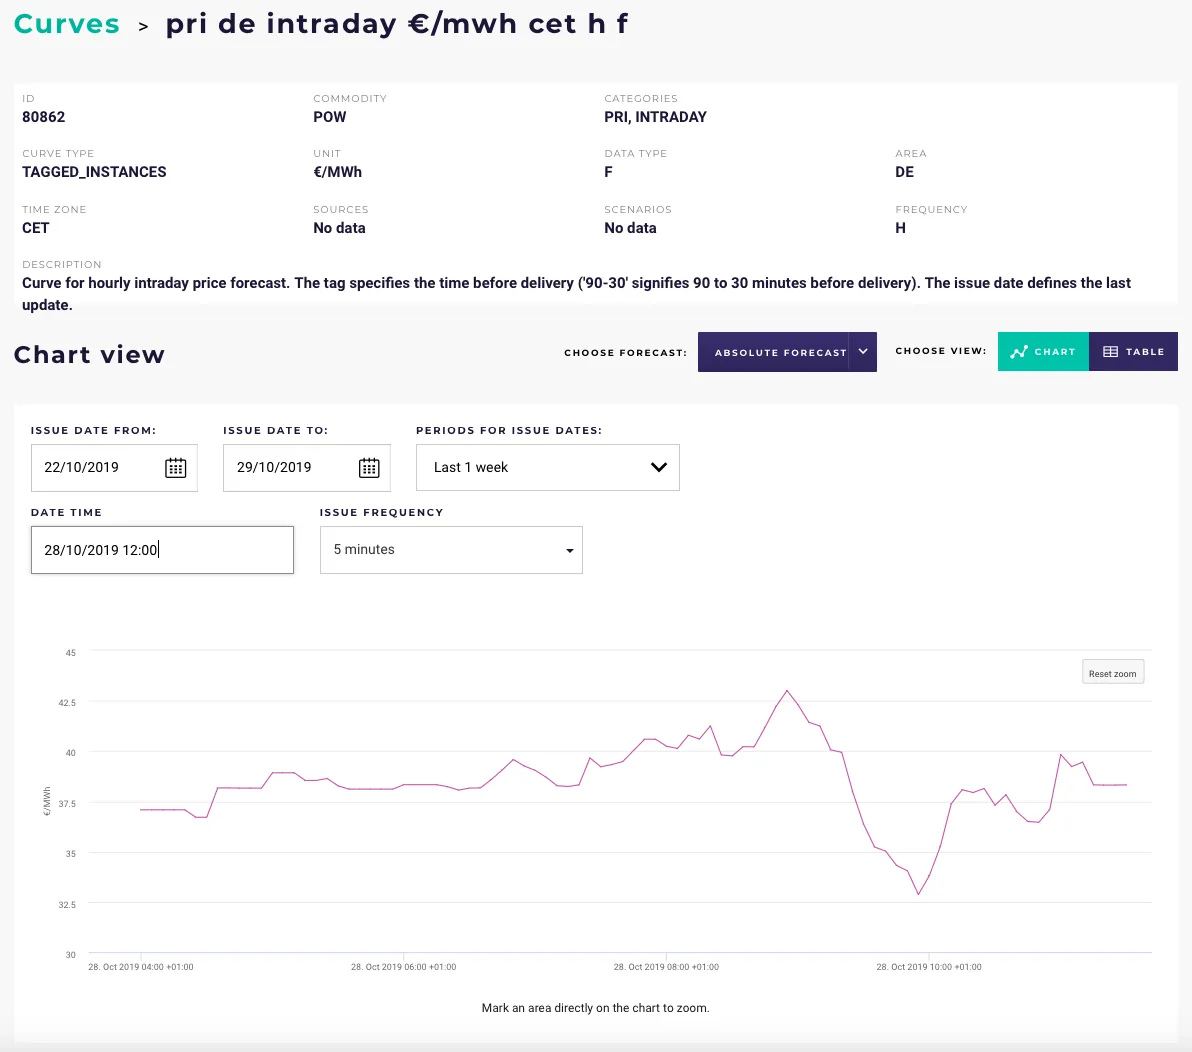
The figure shows the absolute forecast of the hourly price forecast in Germany for the contract starting 28 October 2019 at 12:00. A new issue is released every 5 minutes with an updated price forecast. The absolute forecast shows how the forecast develops without switching between issues.
If the curve has a fixed issue_frequency, the issue_frequency parameter is optional. If
the curve’s issue_frequency is ANY or missing, you must give it; without it the API returns
HTTP 400 (Issue frequency is not known and must be specified). The resulting time series follows that frequency between
issue_date_from and issue_date_to, using the value from the latest instance at or before
each date.
Path parameters
Section titled “Path parameters”| Name | Type | Description | Required |
|---|---|---|---|
id |
integer | Curve ID | Yes |
Parameters
Section titled “Parameters”| Name | Type | Required | Description |
|---|---|---|---|
data_date |
datetime | Yes | The point in time to take from each included issue |
issue_date_from |
datetime | Yes | First issue date of the output (inclusive) |
issue_date_to |
datetime | Yes | Last issue date of the output (exclusive) |
issue_frequency |
string | If the curve has no issue_frequency |
Frequency of the output time series |
tag |
string | For tagged curves: the tag to use |
Relative forecast
Section titled “Relative forecast”GET /instances/{id}/relativeGET /instances/tagged/{id}/relativeA relative forecast joins fragments of selected instances into one time series. From each
instance it takes the part starting at issue_date + data_offset. The fragment ends after
data_max_length, if given, or when the next instance starts.
data_offset and data_max_length are ISO 8601 durations, up to and including days (D).
Weeks, months and longer are not supported.
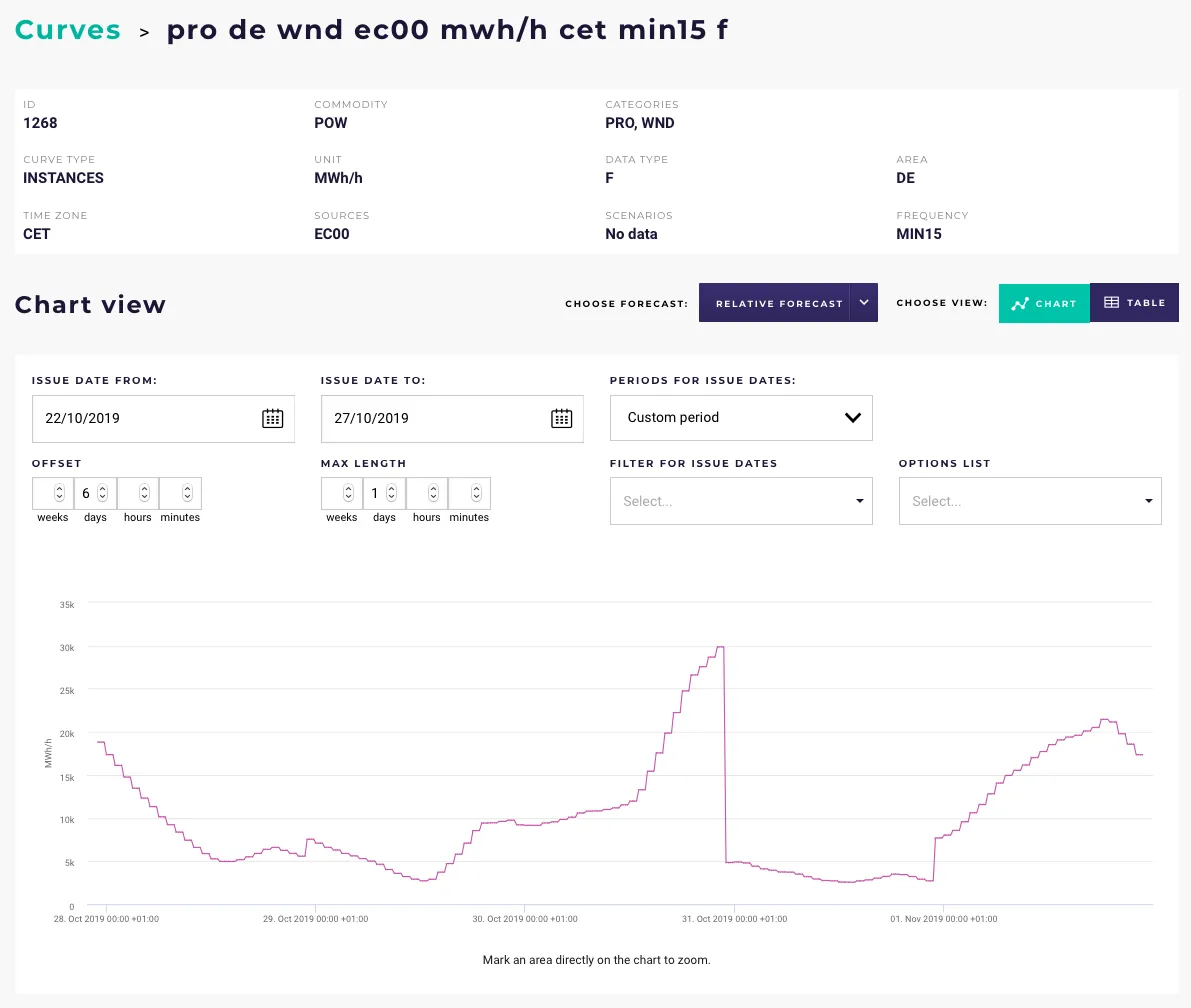
The figure shows a relative forecast of wind power production based on the EC00 weather
model. A new forecast is released every day around 06:00 and extends several days ahead. With
data_offset=PT6H and data_max_length=P1D, each fragment starts 6 hours after its issue date
and lasts one day.
Filter the included issues with issue_time, issue_date, issue_weekday and issue_month.
Path parameters
Section titled “Path parameters”| Name | Type | Description | Required |
|---|---|---|---|
id |
integer | Curve ID | Yes |
Parameters
Section titled “Parameters”| Name | Type | Required | Description |
|---|---|---|---|
data_offset |
duration | Yes | Offset from each issue date to the start of its fragment (ISO 8601) |
data_max_length |
duration | Maximum length of each fragment (ISO 8601) | |
issue_date_from |
datetime | See note | First issue date of the output (inclusive) |
issue_date_to |
datetime | See note | Last issue date of the output (exclusive) |
issue_date |
datetime | See note | Specific issue dates. Can be repeated. |
issue_month |
string | Filter on month of issue date. 1–12 or jan–dec |
|
issue_weekday |
string | Filter on day(s) of week. 0–6 or sun–sat (Sunday can also be 7) |
|
issue_day |
integer | Filter on day(s) of month. 1–31 |
|
issue_time |
string | Filter on time(s) of day. HH, HH:mm or HH:mm:ss (hours 0–23) |
|
data_from |
datetime | Return data values from this time (inclusive) | |
data_to |
datetime | Return data values up to this time (exclusive) | |
time_zone |
string | Change the curve time zone before aggregation | |
output_time_zone |
string | Change the curve time zone after filtering and frequency change | |
filter |
string | Filter out parts of the time series. Filtering is done before aggregation/split | |
function |
string | The aggregation/split function to use when changing frequency | |
frequency |
string | The frequency of the aggregation/split output | |
tag |
string | For tagged curves: the tag to use |