Curve attributes
These endpoints return the possible values of each curve attribute. Use them to build curve
searches and to transform data. Paths are relative to the base URL
https://data-forecasts.volue.com/api/v1/timeseries. All are GET requests with no parameters.
curl -H "Authorization: Bearer $TOKEN" \ https://data-forecasts.volue.com/api/v1/timeseries/curve-attributes/commoditiesCurve metadata
Section titled “Curve metadata”| Endpoint | Returns |
|---|---|
GET /curve-attributes/commodities |
All commodities |
GET /curve-attributes/categories |
All categories |
GET /curve-attributes/areas |
All areas |
GET /curve-attributes/stations |
All stations |
GET /curve-attributes/sources |
All sources |
GET /curve-attributes/scenarios |
All scenarios |
GET /curve-attributes/units |
All units |
GET /curve-attributes/time-zones |
All time zones. Also used to change the time zone of curve data, see Time zones. |
GET /curve-attributes/versions |
All model/curve versions |
GET /curve-attributes/frequencies |
All frequencies. Also used with functions to transform data, see Frequencies. |
GET /curve-attributes/data-types |
All data types |
GET /curve-attributes/curve-states |
All curve states |
GET /curve-attributes/curve-types |
All curve types |
Attributes for data manipulation
Section titled “Attributes for data manipulation”These endpoints return the values you can use to filter, split or aggregate data when you read it. Frequency values work both for searching curves and, together with a function, for aggregating or splitting data to a frequency other than the curve’s own.
Filters
Section titled “Filters”GET /curve-attributes/filtersReturns the possible values to filter data.
Functions
Section titled “Functions”GET /curve-attributes/functionsReturns the possible values to aggregate or split data.
| Key | Name | Description |
|---|---|---|
AVERAGE |
Average value | Average of the values in the curve. Missing values are ignored. |
SAVERAGE |
Strict average value | Average in strict mode: no gaps allowed. Returns no value if there are gaps. |
MAX |
Maximum value | Maximum value. |
MIN |
Minimum value | Minimum value. |
SUM |
Sum of values | Sum of values. Missing values are ignored. |
SSUM |
Strict sum of values | Sum in strict mode: no gaps allowed. Returns no value if there are gaps. |
LAST |
Last value | The last observed value. |
SAME |
Split using the same value | Split using the same value. |
DIVIDE |
Split using fraction of value | Split using a fraction of the value. |
Frequencies
Section titled “Frequencies”GET /curve-attributes/frequenciesReturns the possible output frequencies for an aggregation or split.
Time zones
Section titled “Time zones”GET /curve-attributes/time-zonesTime zones can be used as a parameter on data requests for all curve types:
time_zonechanges the curve time zone before aggregation.output_time_zonechanges the curve time zone after aggregation.
Non-strict and strict aggregation
Section titled “Non-strict and strict aggregation”When you aggregate a weekly (W) curve to months (M), quarters (Q), seasons (S) or
years (Y), watch out for edge cases. They happen when:
- the target frequency has more days per period than the curve frequency, and
- the source and target periods do not line up at the start or end of the date range.
For example, aggregate one month of a weekly curve. If the first week of the month (Monday to
Sunday) starts in the previous month, and you set the start date after that Monday, some days
at the start of the month are missing. Strict aggregation (SAVERAGE, SSUM) then returns no
value for the month. Non-strict aggregation (AVERAGE, SUM) returns a value, but because it
is calculated with gaps, it is not the true sum or average of the month.
How to avoid it
Section titled “How to avoid it”Data at the source frequency is represented by a time stamp at the start of each period.
from is the first time stamp to include, and to is the first time stamp to exclude. So:
- set
fromto the start of a source period (for weekly data: a Monday), and - set
toto the start of the first target period you do not want.
Examples
Section titled “Examples”These examples aggregate March to July 2019 to months (M) on a weekly (W) curve.
Example 1: the whole period as intended
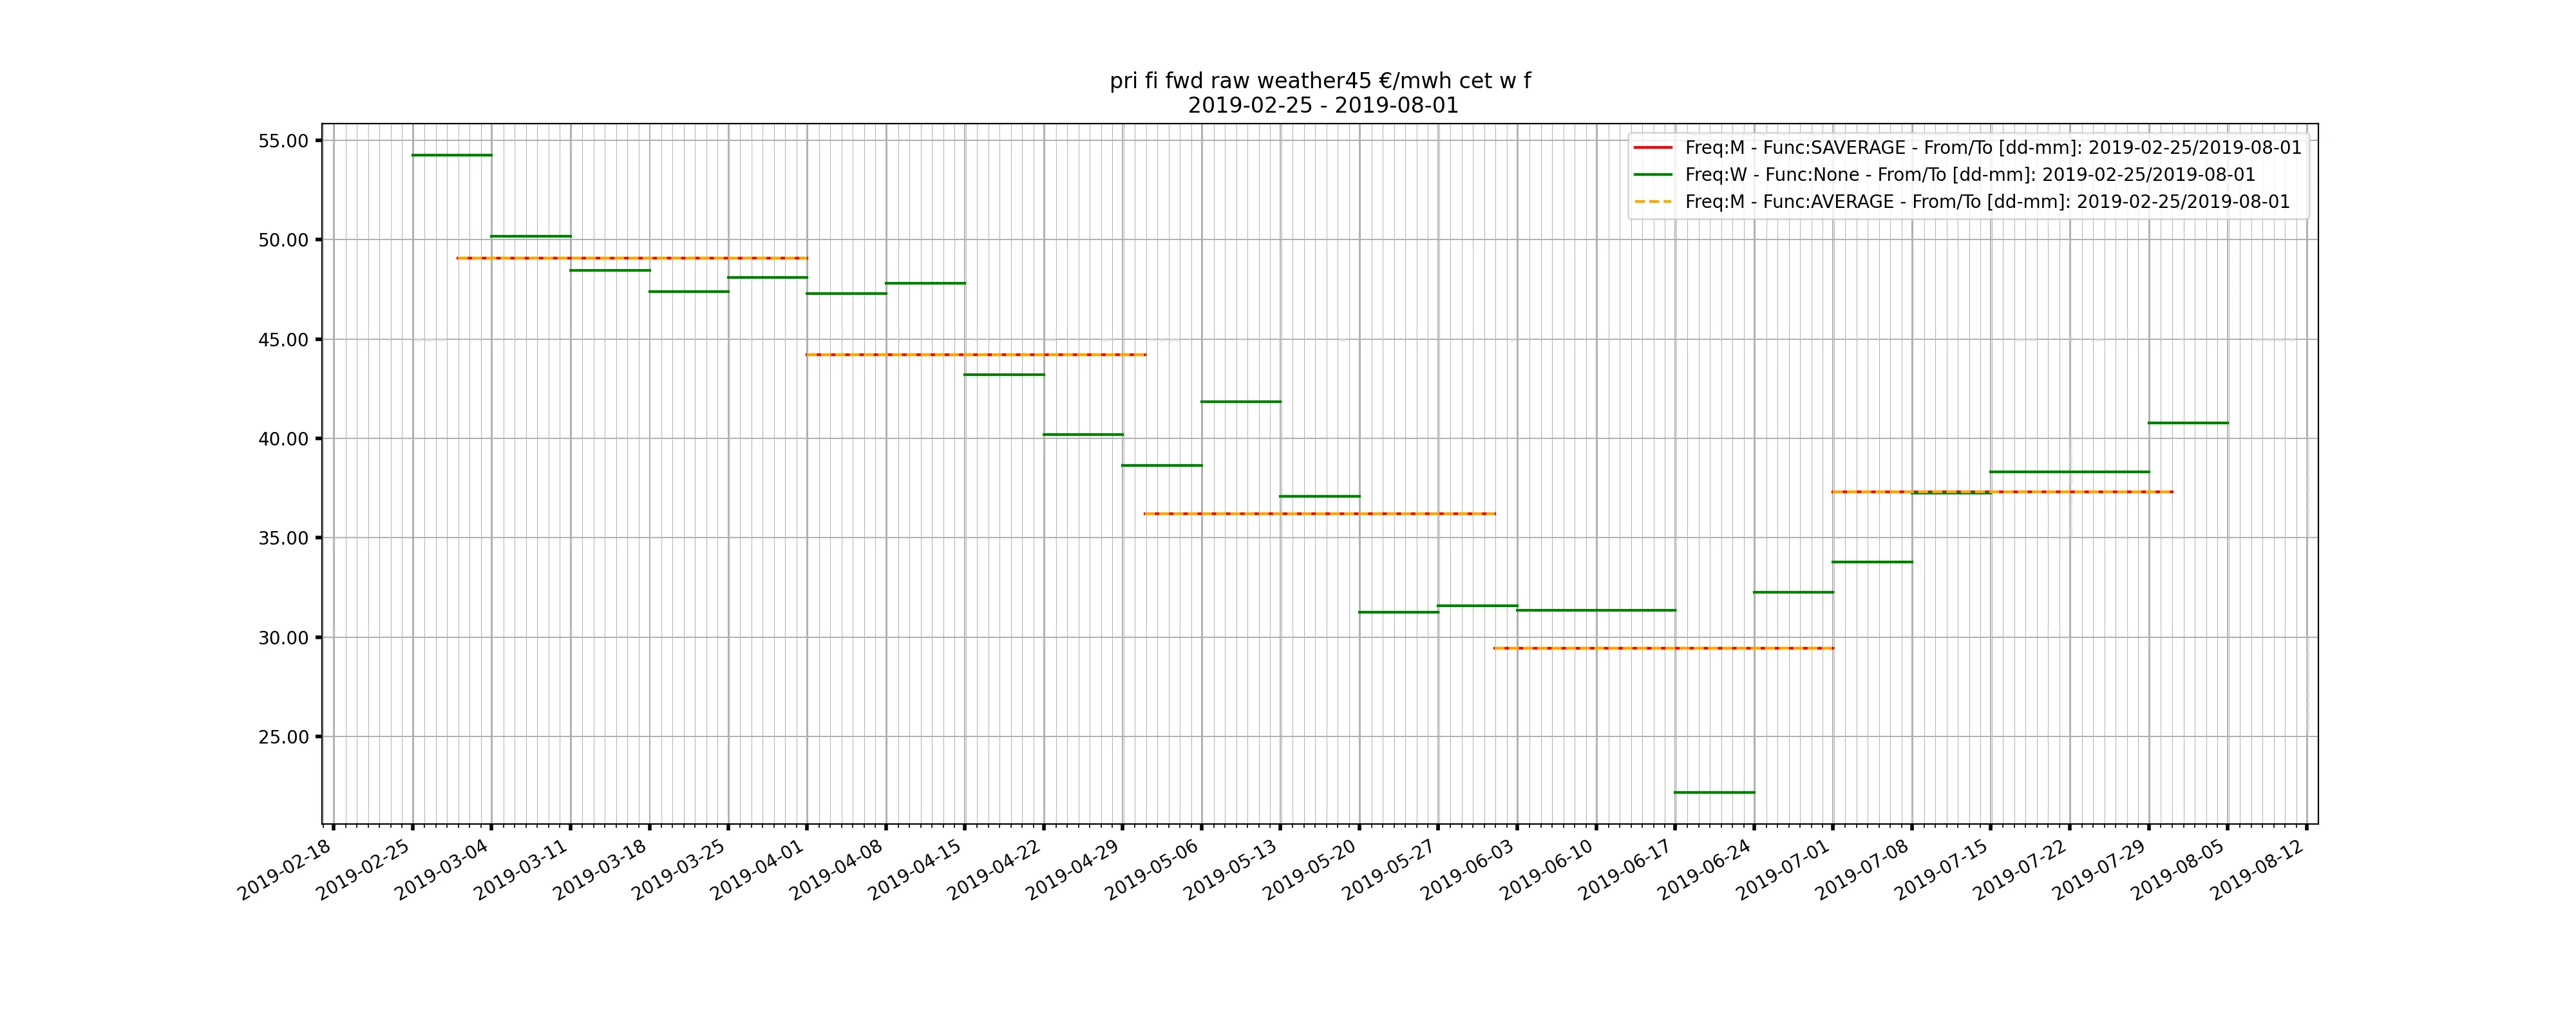
fromis Monday 25 February: the start of the week that crosses into March. The first data point is as intended.tois 1 August: the first day after the period. It is excluded, so the last month is as intended.
Example 2: date range starts too late
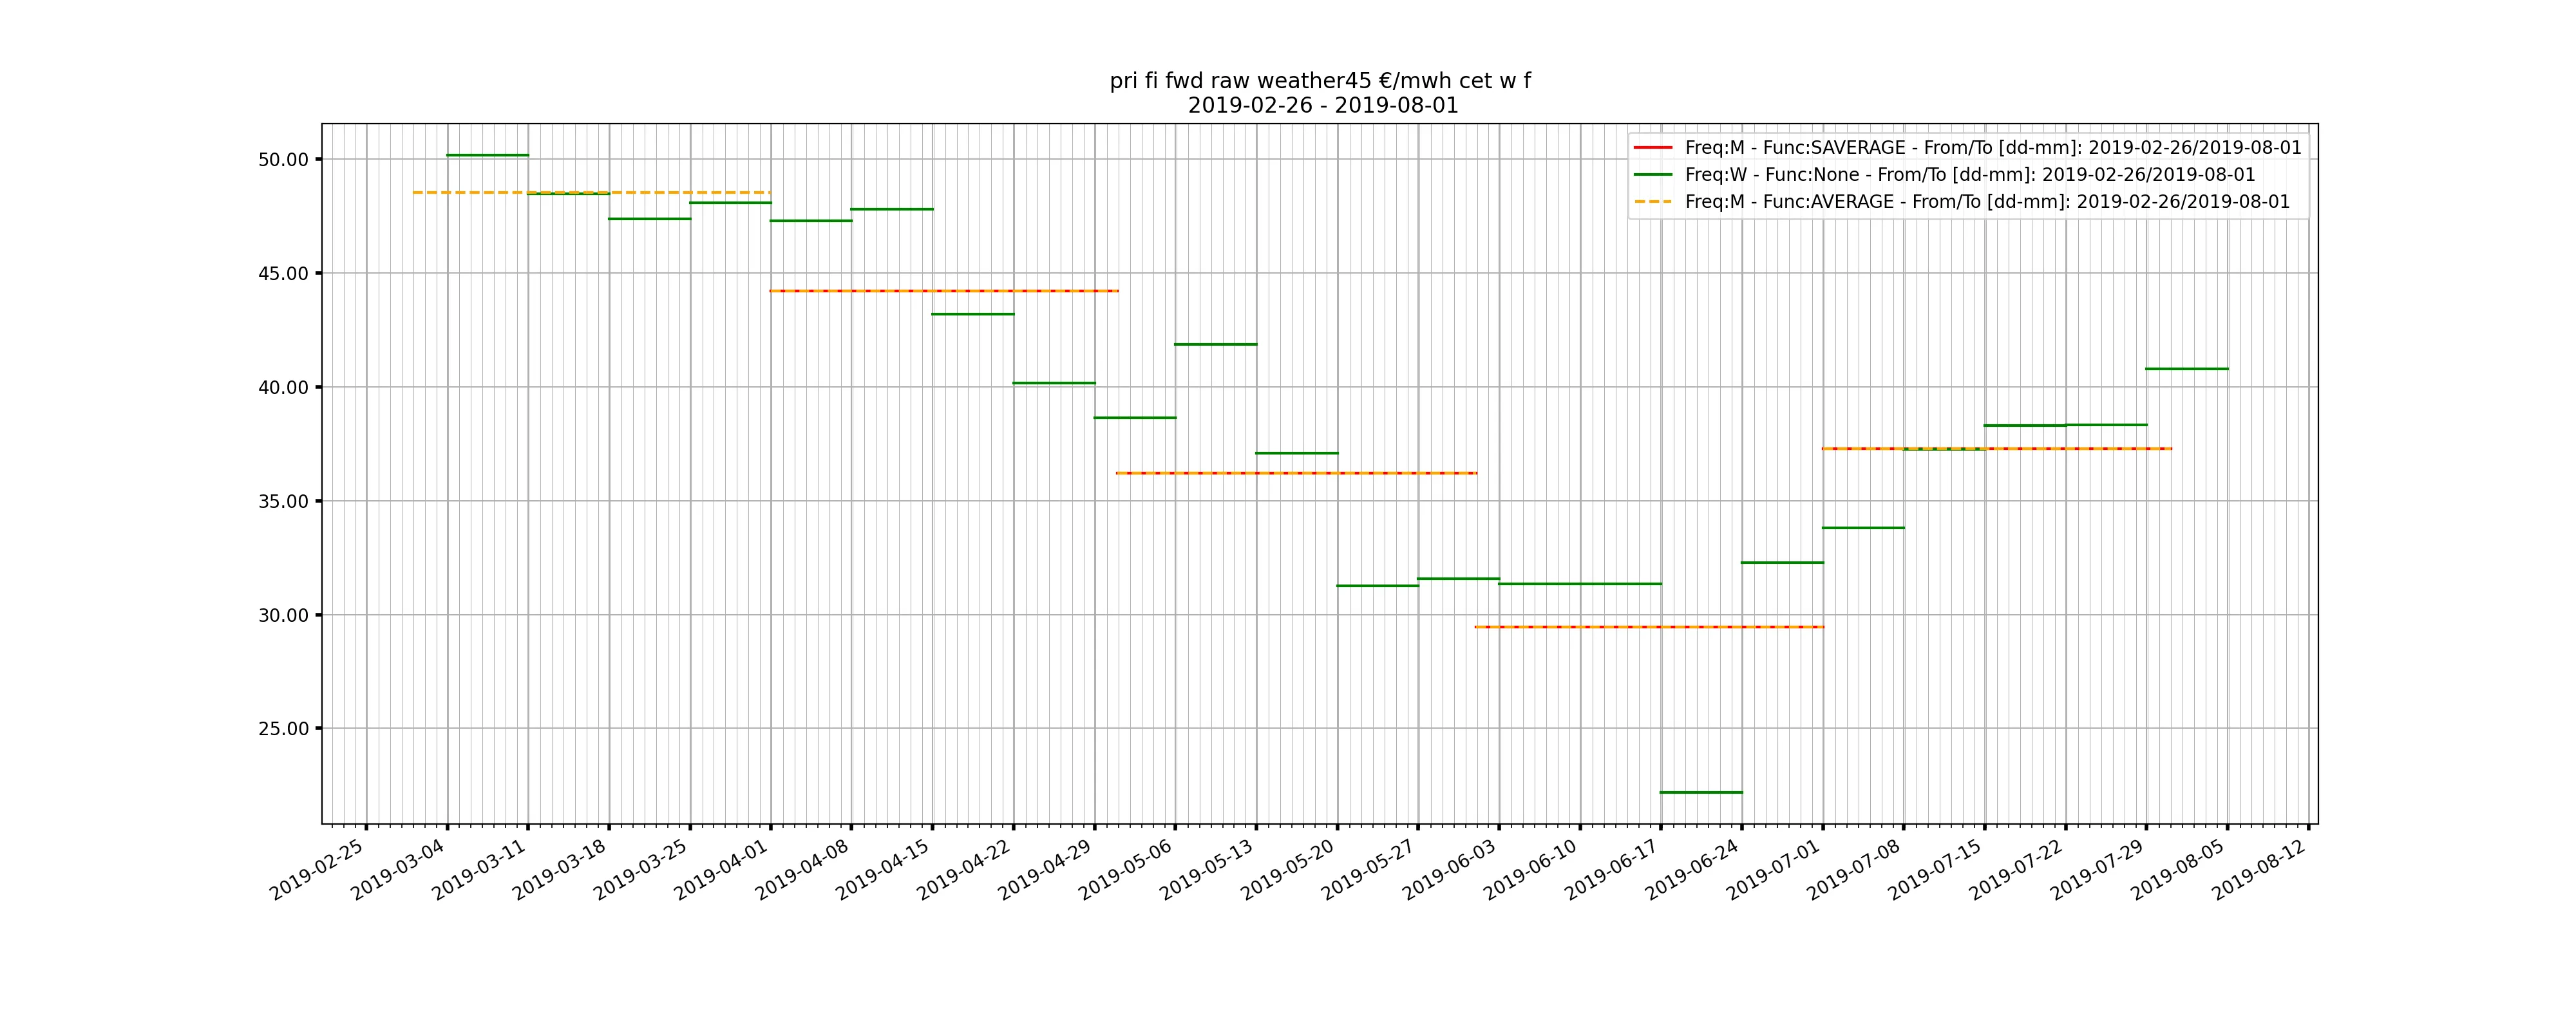
fromis Tuesday 26 February. Weekly data is indexed on Mondays, so the first days of March in that week are not included. Non-strict aggregation still returns a value for March, but it is not the true sum or average.tois 1 August, as intended.
Example 3: date range ends too late
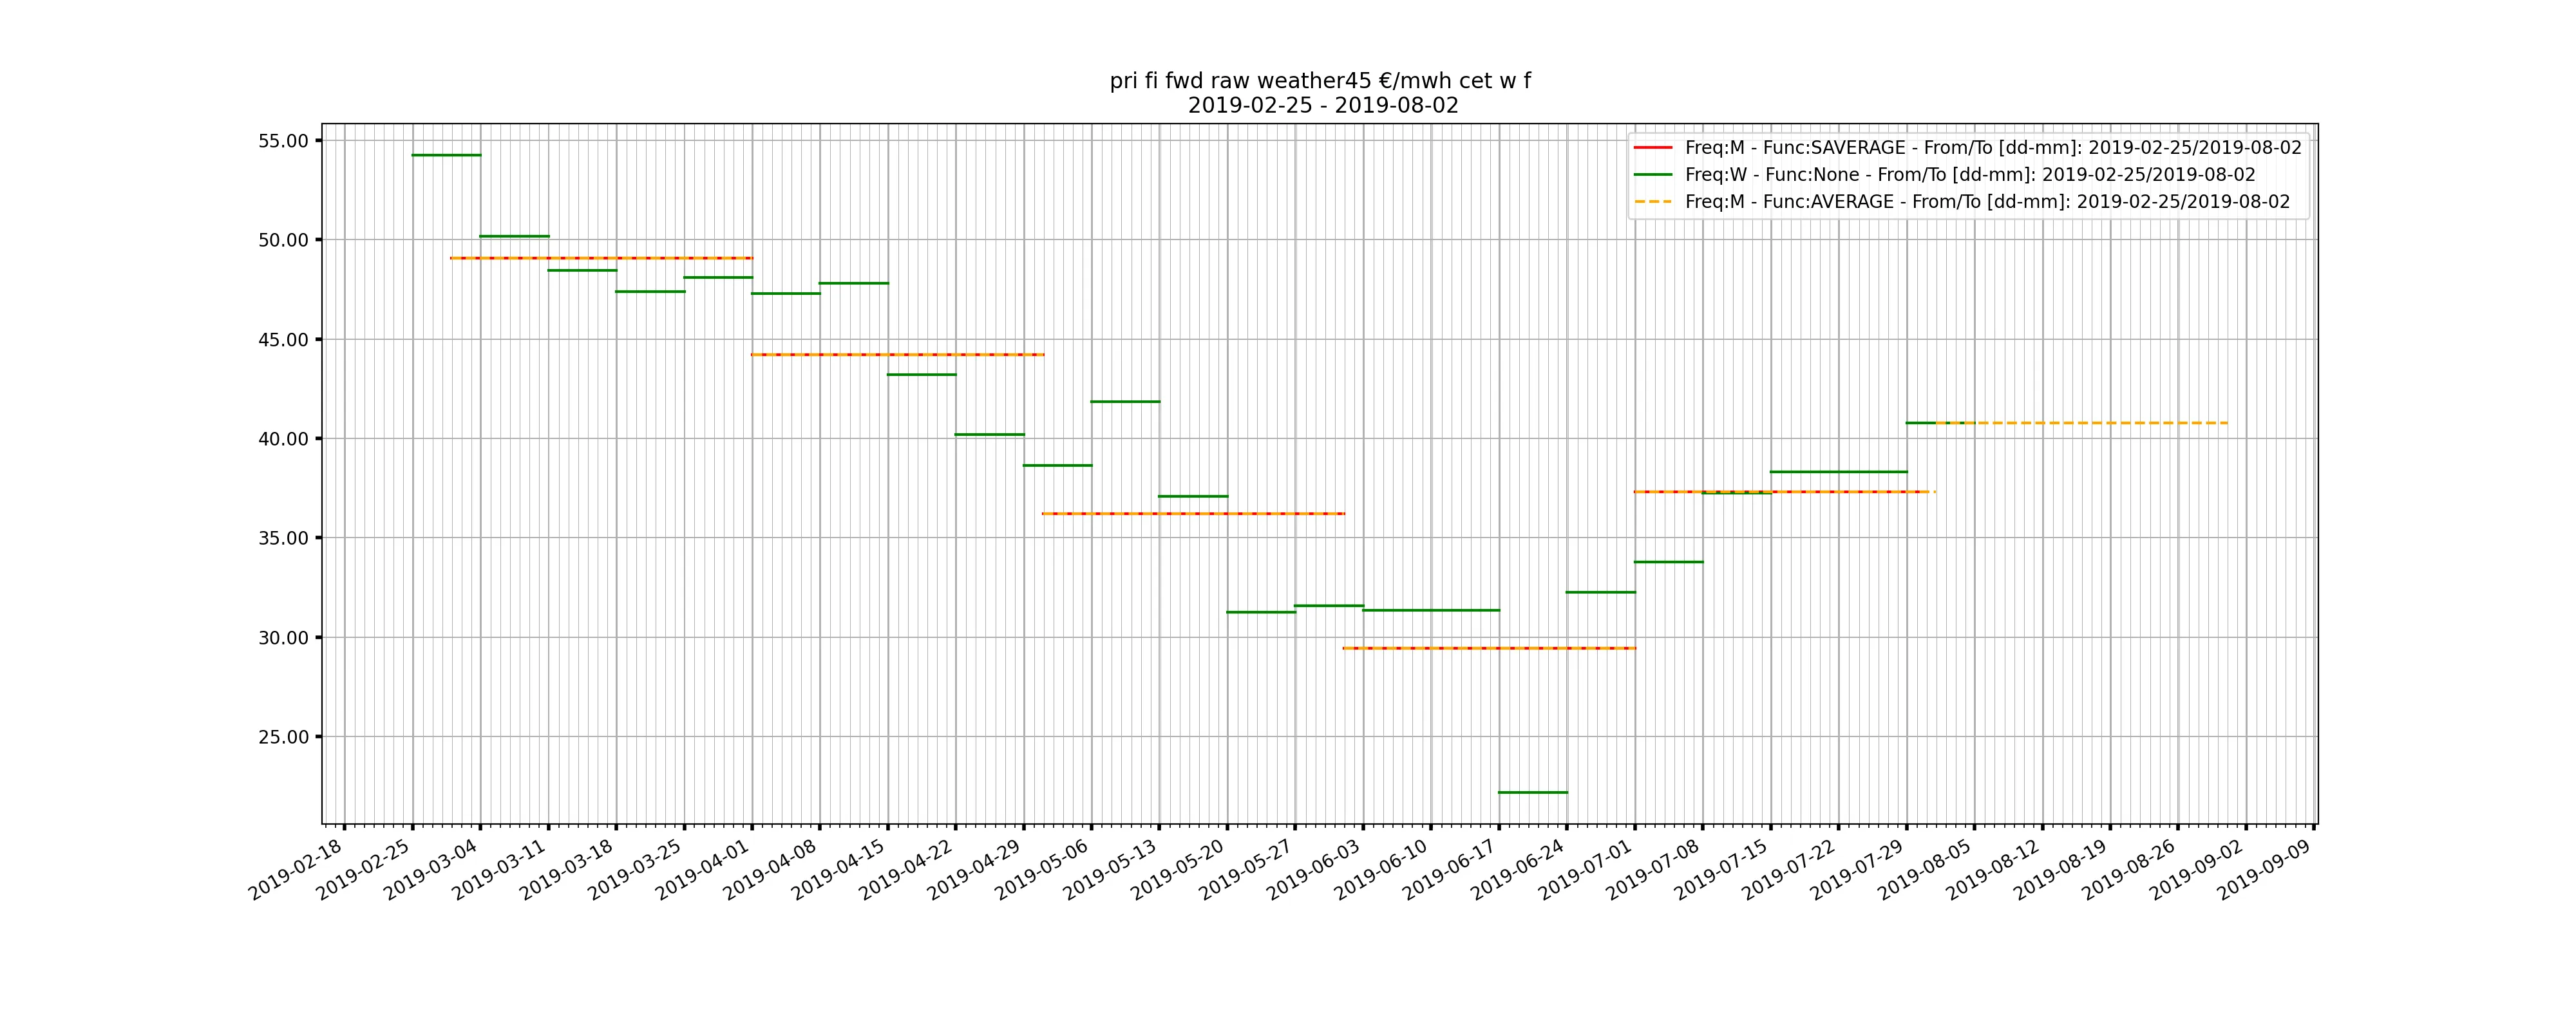
fromis Monday 25 February, as intended.tois 2 August, so 1 August is included. Non-strict aggregation returns an extra value for August, which is not the true sum or average for August.